Safety is not all about flammables
Although you may think that Gexcon’s expertise is predicting the dangers of flammable releases (resulting in flammable clouds, vapour cloud explosions or fires), we never neglected the fact that toxic releases may very well provide an even more serious threat. As you will know, we offer dispersion models that can predict gas concentrations. Translating toxic concentrations into consequences requires a completely different approach than used with flammable clouds. In this blog, we will try to explain the basics about deriving consequences from releases leading to a toxic cloud.
Concentration levels translated into toxic dose
Let’s first make clear that we are focussing on acute intoxication due to inhalation. Of course, specific chemicals (like acids) are known to have skin or eye-damaging effects, while long-term exposure to certain volatiles may also lead to serious chronic diseases. However, in our safety studies practice, we are focussing on accidental and relatively short-time exposures that might directly lead to lethal injuries due to inhalation.
Risks of flammable clouds are related to the cloud’s size and flammable mass. The latter is typically based upon a critical ‘Lower Flammability Limit’ concentration level. However, a toxic effect does not occur above one specific concentration level. To be able to predict potential lethal consequences, the toxic concentration level is converted into a so-called ‘accumulated toxic dose’, which involves the duration of exposure. This would be calculated as ‘concentration multiplied with exposure time’. For such a dose calculation, we must consider that a concentration at a certain location will usually not be constant but a function of time. It usually fluctuates, increasing on the arrival of a cloud and decreasing in time when it passes by. Therefore, we use the integral (or sum) of concentration over time. This procedure is illustrated in the graph below.

For toxic materials, the effect of exposure is also dependent on the level of the concentration itself. We can withstand the smell of ammonia for a very long time without getting injured, but for higher concentrations, the result of inhaling fumes may be devastating. This is why a toxic dose can be corrected with an exponential function, and the toxic dose is actually defined as concentration to the power N * time (CN * t). The value of this exponent N is dependent on the type of chemical and is known as the ‘Probit constant N’. Where a substance like ethylene oxide has a dose exponent (Probit N) of 1, chlorine has a Probit N of 2.75, leading to a higher toxic dose for the same concentration level and exposure time. Below is an illustration of the difference in lethality obtained for concentrations of chlorine (N=2.75) and Ethylene Oxide (N=1) for various exposure times.

Some chemicals, like carbon dioxide, may even use a very high Probit exponent of 8, allowing to define a very sharp level of a concentration at which concentrations turn into ‘lethal dosages’ because now the dose rises very steep with increasing concentrations.
From dose to Probit
After obtaining a toxic dose (CN * t ) for a given chemical, the translation into damage uses two other constants, A and B. They describe the so-called Probit of the exposure, defined as

The resulting Probit Pr is a direct measure of the probability of having lethal effects. Again, these two A and B Probit values are substance-specific constants and allow to distinguish highly toxic from mildly toxic substances. That is why these Probit values are stored in the EFFECTS and RISKCURVES chemical database as unique properties of a toxic chemical.

From Probit to damage
The toxic Probits shown for chlorine and acrylonitrile refer to ‘lethality’ as the resulting damage effect. The Probit can be directly translated into a probability, in this case, the resulting percentage lethality. The same Probit method is also being applied to translate heat radiation into damage like first degree, second degree and lethal burns, now using dedicated Probit values for heat radiation.

French ammonia versus Dutch ammonia
Unfortunately, there is no international consensus about toxicity. Although toxicologists worldwide do collaborate, there is no ‘official’ international agreement on toxicity data. Having a tool that was originally developed based on the Dutch Coloured Books, EFFECTS and RISKCURVES have incorporated officially published Dutch values. Users in other countries may have to adjust Probit values because, for instance, French authorities issued different toxic Probits for ammonia!
Toxic concentration threshold levels
Because toxic Probits have not been internationally accepted, some users also apply typical concentration thresholds. Specific examples of thresholds provided in the EFFECTS and RISKCURVES chemical database are IDLH (or ‘Immediately Dangerous for Life and Health’, published by NIOSH, the American National Institute for Occupational Safety and Health), ERPG-levels (or ‘Emergency Response Planning Guideline’ levels, published by AIHA, the American Industrial Hygiene Association) or AEGL-values (or ‘Acute Exposure Guideline Levels’, published by EPA, the United States Environment Protection Agency).
Although these thresholds state a concentration level (as ppm or mg/m3), the AEGL values are also associated with specific exposure duration, being 600, 1800 or 3600 seconds. That is because we might be able to withstand an IDLH for a few breaths of time, but if we were exposed for a longer duration, there would be more severe consequences. For that reason, it may be highly conservative to use a concentration level contour, for instance, illustrating an IDLH or AEGL-2 threshold, because it does not specify how long this level will be present at that location. Our advice, often more revealing, is to translate concentrations plus exposure duration into an associated dose (although that may include an exponent N to obtain (Concentration)N * exposure time).
The toxic dispersion models in EFFECTS and RISKCURVES allow to specifically plot a ‘user-defined dose’ (ppm^N*min or any other dose unit) as a contour on the background map. Such a dose contour really shows whether a concentration level is actually exceeded during a significant time.

Influence of toxic exposure time and ‘indoors exposure’
Obviously, the duration of a release determines the maximum exposure duration or the passing time of a cloud at a specific distance from the release. Apart from the duration of the cloud, it is common to also limit the ‘exposure duration’ to 1800 sec (half an hour). This is because it is commonly assumed that people will be alarmed in case of an emergency, and the surrounding population will flee or seek shelter.
Typical alarming or even evacuation actions are specifically addressed in emergency preparation plans. Therefore, ‘maximum toxic exposure duration’ can be applied to limit exposure, but we also need to be aware that this ‘cut-off’ time can have different meanings. Do we start to count at the moment of the accident because alarming systems will be triggered at that time? Or do we have a reaction time? Will people react as soon as they smell something after the toxic cloud arrives at their doorstep?
These options can all be addressed in the EFFECTS and RISKCURVES toxic dose calculation. Even when taking shelter inside, a toxic concentration may build up inside due to unavoidable ventilation. This indoor toxic dose build-up, which is highly dependent on the ventilation rate of a building, can also be included in the EFFECTS and RISKCURVES consequence calculation.
Inhalation or ‘receiver’ height
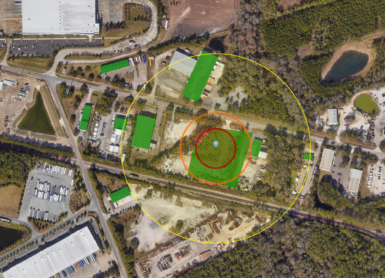
Another aspect to be aware of is that concentrations will vary depending on the height. Toxic lethality is usually reported at 1.5 or 1 m ‘inhalation height’, but especially in the case of heavy gasses, the situation at ground level can be much worse. On the other hand, receivers on elevated levels in apartment buildings can be less affected by a toxic cloud. This is why the receiver height is an important parameter for the calculation: the reported toxic footprint (red-green ‘lethality outdoor’ zone illustrated above) is only valid for that height.
Multiple ‘toxicity’ approaches available
Although the calculation of toxic consequences is not specifically unambiguous due to different approaches that can be applied, our dispersion models support various methods and approaches. The EFFECTS and RISKCURVES chemical database already provide toxic Probits for all common toxic substances, while all known international concentration thresholds have also been included. In case official Probits have not been published for a chemical, a dedicated ‘conversion from animal experiments’ model available in EFFECTS allows translating experimental LD50 values into toxic Probits.
Free viewing demo version of EFFECTS available for download
Do you want to start making the world a safer place?
Get started by downloading the free EFFECTS viewing demo, available for download via the button below.
Do you like what you read?
Get the latest trends in the field of process safety management straight to your inbox, and enhance your skills through knowledge sharing from industry experts.